LifesFun's 101
"The only true wisdom is in knowing you know nothing." - Socrates
Pentesting Mobile Applications Going Through a Tunnel (Webview)
29 Sep 2021
This guide is written under the assumption that the device has been setup for pentesting already, and I will not be going through how to set it up from scratch as there are plenty of other articles out there covering this.
This technique can be used for both iOS and Android devices. Below I will be covering the setup for Android.
Prerequisites:
-
Mobile Device:
- Frida server installed on the mobile device
-
External Pentesting System (Laptop)
- Frida-tools installed on the external pentesting system (laptop)
-
Chrome browser for Webview Debugging
-
Internal Pentest System (within the environment that tunnel links the mobile app to)
- BurpSuite (or other webproxy) installed on the internal system
Issue
At times, a mobile application pentest comes up where application goes through an encrypted tunnel (eg. Airwatch). In these cases, unfortunately a web proxy cannot be directly used to intercept traffic, therefore it’s not possible to mitm and exploit HTTP requests.
TL;DR Solution
This can be done by:
1) connecting the phone to external pentesting system (laptop)
2) using Chrome’s Webview debugging feature to record the requests
3) saving the requests as .har file
4) importing .har file into the browser of the internal system (setup to use web-proxy - BurpSuite)
5) replaying the requests there and capturing/modifying traffic via BurpSuite.
Detailed Solution
Disclaimer: The solution may not be for everyone as it requires to have a machine within the internal network of the application’s back-end. However, if you do have access to a machine within internal network you will be able to replay your traffic there.
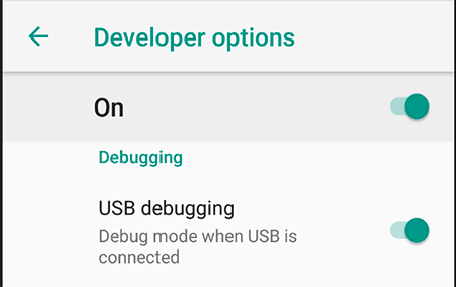
First things first, the device needs to have USB Debugging enabled. This can be done by going to Developer Options and enabling it there.
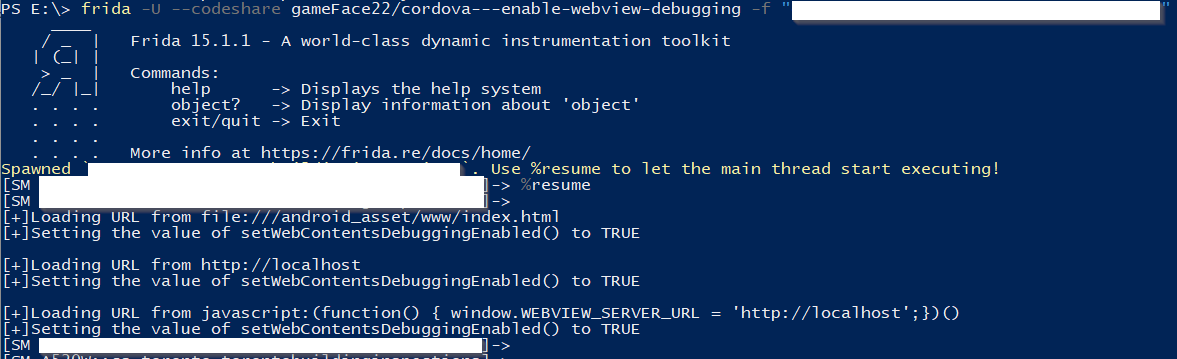
Once the device is in debugging mode, connect it to your “external” pentesting system. The following Frida script can be used to enable WebView Debugging for a particular application (some applications might have it enabled by default, but this is in case your application does not.)
frida -U –codeshare gameFace22/cordova—enable-webview-debugging -f “<app name>”
Alternatively you can download the script and run it locally with Frida.
When you run the script don’t forget to type %resume for the execution to continue, otherwise it will just be sitting in the limbo.
The process should look similar to screen capture below:
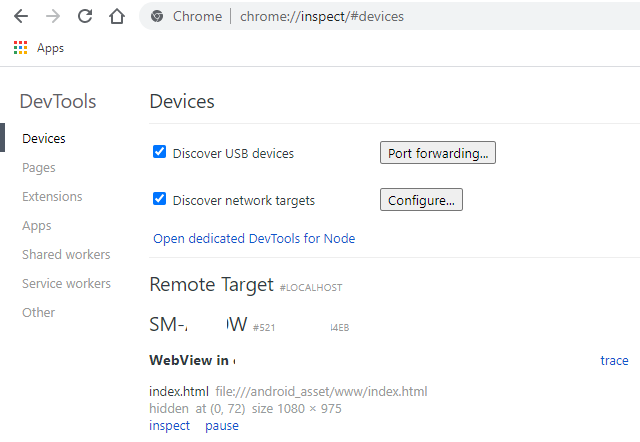
Once this is done head to Chrome browser and type in the following in the search bar:
chrome://inspect/#devices
If all of the previous steps went successfully, you should see a screen similar to the one below (where it will say the following: Webview in “Application’s Name”) :
At this point Chrome in your external pentest system can be used to log network traffic (along with checking what kind of information WebView stores).
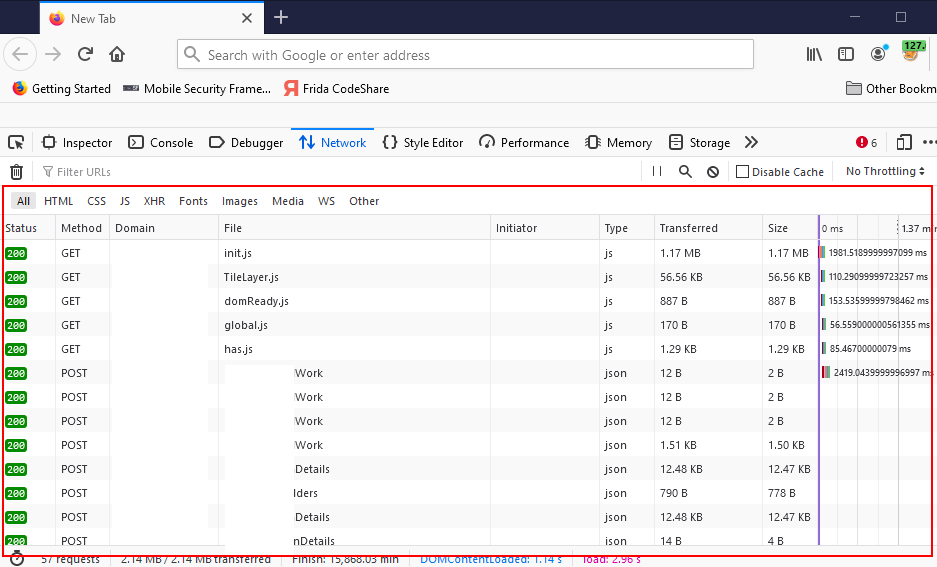
Once you press “inspect” button, another window will open with Chrome’s debugging features. This can be seen on the screenshot below.
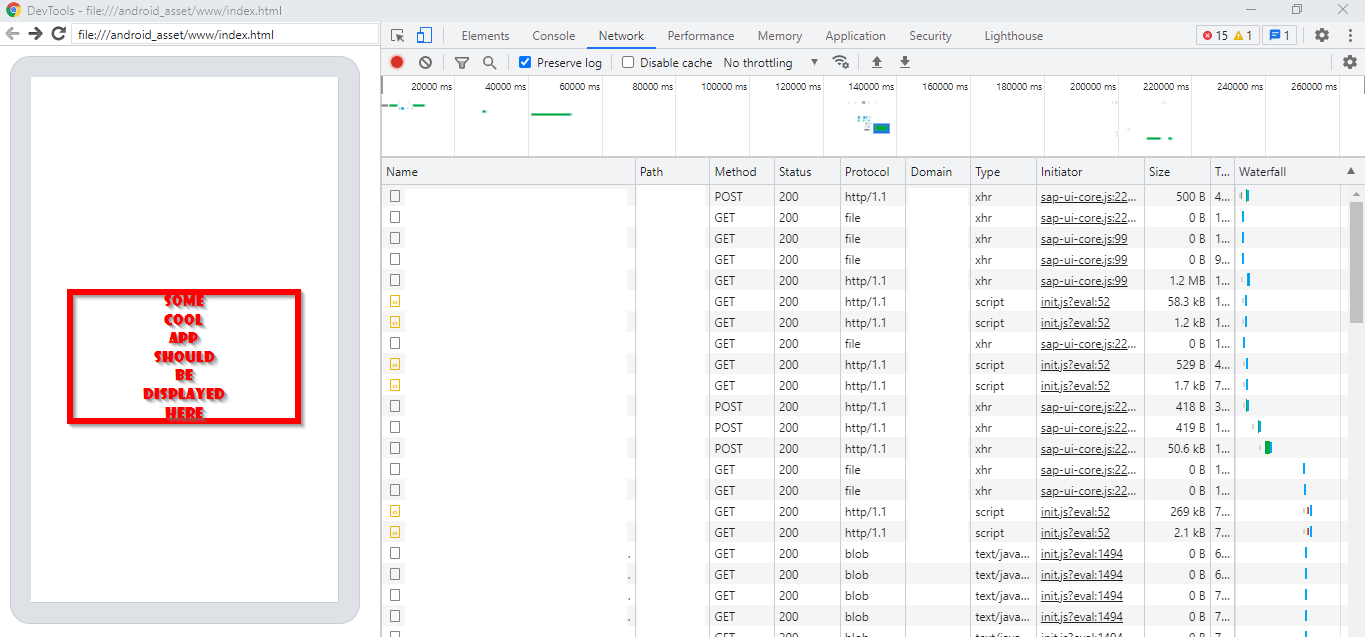
At this point you can either use the simulated window within the browser to interact with the application or use the mobile device itself. I prefer using the mobile device as it is faster and more convenient.
As you browse the app and perform certain actions, you should see HTTP requests and responses generating as shown on the previous screenshot.
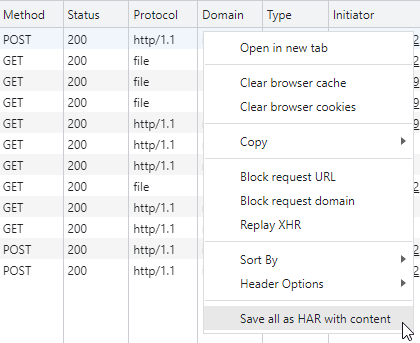
As you feel you have generated all of the requests that are needed for your assessment or at least for the time being you can then export all of them as an .har (HTTP archive) file. This can be observed on the screenshot below.
At this point transfer the saved archive to the internal system. Open browser of your choice, pull up developers console (F12) and import HTTP archive into the browser. This can be achived by simply dragging it to the Network portion of the developer’s console. into the browser, as seen on the following capture.
Now double click on any of the requests to replay. Due to being on the internal network, these requests can be issued directly to the back-end server.
Once you double click on the request, you should see it being issued by the browser and captured by the web-proxy (don’t forget to configure your browser to use the web-proxy).